

A data-driven look at how a digital-first approach to fundraising is lifting online fundraising and offline fundraising metrics for 27 organizations.
As a fundraising leader, you’re inundated with countless benchmark reports that largely all share the same overarching giving trends. These reports are helpful to stay informed about the sector, but they only show you the average—the status quo.
No effective leader has ever been content with the status quo. You shouldn’t be either.
That’s why this first-of-its-kind report is specifically designed to show you the performance of organizations that are taking a radically different approach to their fundraising program.
All the data you will find in this report comes from 27 nonprofit organizations that are adopting an approach that we call Digital-First Fundraising.
Industry benchmark reports with a larger sample show how you compare to the average organization. But this report will show you how you compare to organizations seeing significant growth.
Other similar reports with a larger sample rely on survey data. Let’s be honest, everyone inflates their performance if you have to report it yourself. And we know first hand that self-reported data of this kind is often messy and unreliable.
By keeping the dataset small, you can see how you stack up against real fundraising performance data from rapidly growing organizations.
Digital-first fundraising puts digital in a position to lead and lift your whole fundraising program.
It doesn’t throw out traditional fundraising channels or trade your major gifts team for impersonal emails. But it’s more than just bolting on digital components to your direct mail program.
Instead, it leverages a mindset that thinks about digital as the primary point of engagement—empowering and increasing the effectiveness of all channels.
There’s more to unpack about what it means to be digital-first. But let’s jump into the data and see how this approach impacts overall fundraising results.
Digital-first organizations represent a segment of rapidly growing nonprofit organizations. Revenue from giving has grown by 25% over the past 5 years—this is inclusive of all online & offline donations as well as broad, mid-level, and major donations.
We will celebrate any kind of growth! But what’s of particular interest is where these organizations are seeing growth.
This should not come as a surprise. The overall giving trend, even for traditional organizations, is that online giving is growing as an overall percentage of individual donations.
But the rate of online revenue growth is particularly noteworthy.
When we look specifically at broad base donations, we see significant growth across both online and offline giving channels. But digital growth significantly outpaces offline growth.
Mid-level and major gifts can be heavily influenced by the economic outlook more so than smaller donations, so we’ve excluded them for the time being.
What’s a Broad Base Donor?
Broad base donors are individual donors that do not qualify as a “mid-level” or “major” donor. Every organization has different thresholds for mid and major donors.
Generally speaking, a donor often gets classified as “mid-level” if they give $1000+ in a given fiscal year. They often get classified as “major” if they give $5,000+ or, in some cases, $10,000+.
Why Is This Chart Just Looking At Broad Base?
When talking about growth of individual giving, overall revenue results can be dramatically swung by a handful of major donations. And when there are concerns about a slow economy (like we’ve experienced the past couple years), the slow pace of major donations can skew the results.
These economic fluctuations don’t impact broad based donations nearly as much—making it a better measurement of growth on a year-over-year basis.
As you can see, online growth has steadily outpaced offline growth over the past 5 years. Broad base online revenue has grown by 99% over the past 5 years while broad base offline revenue has grown by 36%.
That means that broad base online donations are growing 175% faster than broad base offline donations.
With a strategic investment in digital, these digital-first organizations were uniquely positioned for success during the COVID-19 pandemic. When all-in person activities ceased, they were able to pivot their fundraising efforts far more effectively than the average organization.
Across the board, most organizations saw what we called the “COVID Bump.” There was an overall uptick in giving during 2021, and individual giving grew by 5.6%.
Digital-first organizations saw an even greater increase than the average nonprofit—growing revenues by 22.5%.
When there are fears of recession and a poor economy, it’s common to see mid-level and major giving slow down. And after a rapid rise in inflation and much speculation over the strength of the economy, most organizations saw their high revenue numbers of 2021 fall back down to earth.
But digital-first organizations were better prepared.
In 2022, individual giving dropped by 6.4%. Major gifts were slower as many donors hesitated to give due to fears of a recession.
But digital-first organizations only saw a 3.9% drop.
Interestingly, these organizations still were able to significantly grow their online broad base giving by 5%—making up for a slow year for mid-level and major donations.
Many fundraising leaders care primarily about their major giving programs—and rightfully so. You can often spend a lot less time, energy, and resources to have a conversation with a single major donor—and yield far greater returns than any broad base program will yield.
But focusing on major giving at the expense of building a broad base digital program is neglecting your major donor pipeline of the future.
Digital-first fundraising leaders are not giving up major donor results. In fact, major gifts have increased for digital-first organizations by 18.6% over the past 5 years.
Additionally, these organizations have seen mid-level giving increase by 32.4% over the past 5 years.
Finally, although most major giving typically happens in an offline channel, the growth of online major gifts has outpaced offline major gifts over the past 5 years.
Find out how we can help your nonprofit achieve sustainable growth with your 3-Year Fundraising Roadmap – go from “what now” to “dialed in” in less than 90 days.
Traditional fundraising thinking suggests that online donors are not nearly as valuable as offline donors.
Most experts that share this advice often represent agencies whose entire business model is built around direct mail. Their primary revenue source relies on nonprofits investing heavily and increasingly into direct mail programs.
These same experts often provide digital services too, but the online strategies are often surface level and are an add-on service to the direct mail strategy.
Here’s the truth: Online donors are actually more valuable than offline donors.
Anyone who tells you otherwise either doesn’t have the data to prove it, or they don’t know how to implement effective digital strategies.
While we also have a bias, we also have the data to prove it. Let’s take a look.
Absolutely not! ❌
Direct mail is and will be a major portion of any organization’s fundraising program for many years to come. But the giving preferences of donors are shifting over time.
Increasingly as wealth transfers to younger generations, a higher percentage of would-be donors are preferring to give online. In some cases, they will give online exclusively.
Digital-first organizations are using direct mail more strategically than ever—powering their mailing lists with online behavioral data and lifting their direct mail results using a multi-channel approach.
All in all, for digital-first organizations, the first-year value of a new online donor is greater than that of an offline acquired donor. Looking at total revenue generated from these new donors in their first year, online acquired donors were 48% more valuable than offline donors.
This doesn’t mean you should throw out direct mail as a channel. In fact, your online channels can make your offline channels even more effective.
In one experiment, we saw that the coordinated effort of email and direct mail appeals was far more effective than using either channel on its own. A joint Direct Mail & Email Appeal increased conversions by 61% compared to sending only a direct mail appeal.

According to our data, a new online donor has the potential to be more valuable on their first gift than an offline donor. In 2023, the average gift size for a new online donor was $59.07. This was 53% higher than the average gift size of a new offline donor.
Add to it that digital donor acquisition is often cheaper than offline donor acquisition and it’s hard to argue that digital donor acquisition is not worth the effort.
In addition to the higher first gift, new online donors also have a greater chance of giving to a digital-first organization again within their first year. A new donor who gives twice in their first year is 114% more likely to retain in year 2 than those who just give once.
That means that new donors acquired online have a greater likelihood of retaining in year 2.
The traditional thinking that online donors are not nearly as valuable as offline donors is dead wrong. If your organization isn’t yet seeing this type of value from new online donors, it might mean that you need a new approach to your digital fundraising.
Another myth of traditional fundraising thinking suggests that online donors don’t retain as well as offline donors. And this couldn’t be further from the truth either.
When it comes to retention, there are two primary metrics to analyze:
Donor Retention: how many donors who gave last year will give again this year?
Revenue Retention: how much revenue that was given last year will I see again this year?
Donor Retention exclusively measures an individual’s likelihood to make another transaction. Revenue Retention will tell you how much new revenue you need to go acquire from new donors in the next year.
As any experienced fundraiser knows, donor retention is one of the hardest metrics to optimize. There are many factors that can influence retention: everything from the first donation experience, to how a donor is onboarded, to your ongoing cultivation strategies.
As a result, retention rates can vary greatly from organization to organization.
As we look across the data of these digital-first organizations, we see minimal difference in the retention rates of new online and new offline donors. In 2021, online and offline retention rates were nearly even. In 2022, online donors retained slightly better than offline. In 2023, offline donors retained slightly better than online.
Any notion that online donors are somehow less committed than their offline counterparts is misplaced. With the proper intention and cultivation, online donors will stick around and continue to give at least as well as offline donors.
As we look at where new donors gave their second gift in 2023, we see that 18% of new donors gave their second gift in a different channel than their original donation.
Yes. 📊
I’m glad you like it too.
Looking at donor behaviors across channels gives us a fascinating insight into the humanity of a donor. Fundraisers tend to bucket donors into channels. But donors simply interact with the messages that are in front of them regardless of channel.
Understanding this radically changes our approach to stewardship and cultivation.
For example, one organization ran branded advertisements via Facebook alongside a direct mail donor acquisition campaign. Donors who saw the branded ads were 35.8% more likely to respond to the direct mail campaign.

Interestingly, this analysis of second gift channels continues to bolster the idea that online donors are as valuable as (if not more valuable than) their offline counterparts.
In 2023, online donors who gave their second gift online were 10.6% more valuable than those online donors who gave their second gift offline. Similarly, offline donors who gave their second gift online were 27.8% more valuable than those offline donors gave their second gift offline.
In short, the most valuable new donors in 2023 were those who gave their second gift in an online channel.
Find out how we can help your nonprofit achieve sustainable growth with your 3-Year Fundraising Roadmap – go from “what now” to “dialed in” in less than 90 days.
As you might expect, the key online metrics for a digital-first organization often look different from the average organization—but not always in the way you might expect. We’ll unpack that more shortly.
First, let’s define the three primary digital fundraising metrics that can tell you where to optimize your fundraising program:
Website Traffic: This measures how many people are actually showing up on your website.
Conversion Rate: This tells you how many of your site visitors end up donating.
Average Gift Size: This is the average size of an online donation.
Multiply these three metrics together and you get your online revenue. You can apply this same model to your other channels as well—just swap out “Website Traffic” for things like “Direct Mail File Size” or “Event Attendees.”
Analyzing a subset of these digital-first organizations, we’ve found the following averages for these three key digital metrics:
In Back to the Future, Dr. Emmett Brown used the Flux Capacitor to launch he and Marty McFly in to the future.
We believe these 3 metrics give us a simple understanding of the levers we can pull to launch our fundraising into future growth.

This web traffic metric is one of the biggest distinctives of a digital-first organization. For an investment in digital to generate a positive ROI, it generally means using advertising to reach a larger audience with content.
As a result, digital-first organizations tend to have higher traffic than the average organization.
Your web traffic volume is one of the strongest indicators of your readiness to build a digital-first program. Low traffic organizations often have to start by making a large advertising investment just to get a healthy amount of traffic.
Higher traffic, however, often means a lower global conversion rate. This is not a bad thing! It simply means that your traffic is diverse enough to include both existing subscribers and donors as well as new users and potential new donors.
Example of a High Traffic Organization
The graph below shows the 2023 performance of an organization that generates 1.45 million web visitors per month. As you can see, conversion rates are below the average. But what they lack in global conversion rates they make up for in total giving volume.

More web traffic and a wider reach often means a lower motivation to give. As a result, an average organization that has yet to build a sophisticated digital program may in fact see higher site conversion rates. If this is the case for you, it means you likely have lots of opportunity to grow your traffic and overall digital program.
A high conversion rate is very exciting! That means the motivation of your traffic is aligned well with your value proposition around why someone should give.
However, a high conversion rate on its own doesn’t lead to revenue growth. It may be a sign that you’re not investing enough in growing your web traffic.
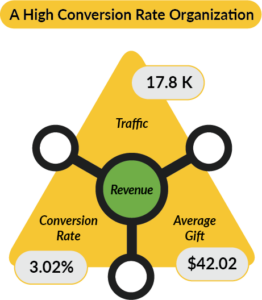
Example of a High Conversion Rate Organization
The graph below shows the 2023 performance of an organization that has a very high global conversion rate of 3.02%. Conversion is high, but traffic is relatively low. It’s possible that this organization may be able to increase revenue by focusing on growing traffic—even if their conversion rate takes a small dip.
Most digital-first organizations are investing significantly in digital acquisition. And as you know, a donor’s first gift is rarely their best gift. With many new donors coming in online, the overall average gift size for a digital-first organization may be lower than the average organization.
This is where organizations must adapt a different mindset with their digital channels. The ROI on digital acquisition comes in the longer-term value of the newly acquired donor.
A high average gift size means that your donors are very invested. They care about the cause and believe you can help them make a meaningful impact.
But a high average gift size can also mean that your current web traffic doesn’t have many potential new donors in the mix.
If you’re seeing very high average gift sizes, it may be an indicator that you need to invest in expanding your audience and reaching potential new donors.
Example of a High Average Gift Size Organization
The graph below shows the 2023 performance of an organization that has a very high average gift size—but their web traffic falls below the average. For this organization, digital growth may come from investing in advertising to reach new audiences and potential new donors.

Find out how we can help your nonprofit achieve sustainable growth with your 3-Year Fundraising Roadmap – go from “what now” to “dialed in” in less than 90 days.
Often the first step in building a digital program is to invest in a modern donation platform. Many fundraising leaders implementing a modern donation platform for the first time assume they can setup their new donation page and then donations will come.
The reality is that a digital-first program is made up of many different donation pages supporting various donor acquisition and activation campaigns. In fact, we’ve identified three primary types of donation pages:
The primary donation page on your website, often the page linked to from a “Donate” button in your website navigation.
A dedicated donation page used for email appeals and high urgency campaigns like year-end.
A dedicated donation page used for new donor acquisition, often taking the place of a traditional confirmation page after an email offer landing page.
Each type of page performs at different rates. Here’s what we’ve found to be the average conversion rate of each type of page:
Great question. 😊
There’s a lot of nuance between each page, but also a lot of overlap.
The first step is to learn the essentials of the main donation page. Your campaign page and instant donation pages are more customized and tailored versions of the main page. To make life easy for you, we’ve created a free template to show you what we’ve learned works (and doesn’t work) to improve giving on your main donation page.
Get the main donation page template for free here »
P.S. Every idea in the template is based on learnings from 6,000+ online fundraising experiments. It’s not our gut feeling—it’s what the data says is most effective.
There’s no way around it—a healthy digital-first fundraising program makes a significant and intentional investment in digital advertising.
While the bulk of this advertising spend is focused on new donor acquisition, an increasing number of digital-first organizations are diversifying their advertising spend to try and influence donor retention as well.
The typical digital acquisition model relies on a multi-step conversion process:

This content-first approach to acquisition doesn’t just work in paid ads. We’ve found that it is often the most effective way to convert casual readers on your site into donors.
One organization tested a “Dear-Reader” style offer on their article pages. The original version made a clear and compelling donation ask at the end of the article. They tested a version that offered a free online course first, and then asked for a donation on an instant donation page after the reader had filled out the course signup form.
Leading with free content led to a 52% increase in donations, and they added even more new email subscribers in the process.

We’re not fans of keeping “trade secrets.”
Instead, we’ve outlined the mechanics of this digital donor acquisition model for you in a blog post here: https://www.nextafter.com/blog/donor-acquisition-a-proven-4-step-model-to-acquire-new-donors/
P.S. At the end of this Advertising section, you’ll find KPI benchmarks to help you know if your digital ads are performing well, or if they need some optimization.
That said, there is a large amount of variance in how much organizations spend. A brand-new organization with minimal traffic often must spend a larger amount of money to acquire the traffic needed for growth.
In one case, an organization founded within the past 3 years is spending +64% of their current giving on digital advertising in order to build a strong foundation of broad base support.
Every organization is at a different place in their advertising spend and sophistication. In fact, determining your advertising spend based on an average would be malpractice. Instead, your advertising spend should be determined based on your readiness for growth.
Consider the chart below showing 4 categories of digital-first organizations by their advertising spend and ROI from instant donations.
Aggressive Growth
Ad Spend > 2.7% of Giving | Instant ROI < 30%
These organizations are spending a high percentage of donation revenues on digital advertising. In some cases, they’re laying a foundation of digital donors knowing that the greatest payoff will come down the road. In other cases, they are more concerned with generating awareness of the cause and organization than they are with getting a high instant ROI from their campaigns.
Ad Spend > 2.7% of Giving | Instant ROI > 30%
These organizations have found the sweet spot between aggressive growth and a sustainable instant ROI. Some of these organizations are relatively small in scale, and others have large and sophisticated programs. But all of them are aggressively spending according to their means to sustain a strong and healthy fundraising program.
Ad Spend < 2.7% of Giving | Instant ROI < 30%
These organizations are generally new to digital-fundraising. They’re making an intentional investment to grow their digital program, but are still dialing in their strategies and campaigns before making a larger investment.
In some cases, these organizations work in a niche or regionally-limited cause—which can often make rapid digital growth a challenge.
Ad Spend < 2.7% of Giving | Instant ROI > 30%
These organizations are making a small investment in digital advertising, and their advertising ROI looks fantastic. If your instant ROI on digital advertising is this high, you’re ready to add fuel to the fire. The next step for these organizations is to make a larger investment in digital and see how far their advertising success can take them.

Finally, you can’t just dump your whole ad budget into direct donation asks on Facebook and expect to see good results. Effective advertising requires intentional testing, diversified channels, and disciplined management of budgets and performance.
Below is a breakdown of Key Performance Indicators that digital-first organizations use to measure their advertising performance—including our minimum targets for a given campaign as well as the top organization’s performance for each metric.
There is a seemingly infinite amount of metrics you can measure in your digital ads. Using the acquisition model outline above, we’ve zeroed in on these metrics as the essentials for optimizing your digital advertising performance.
Beyond the high-level digital advertising KPIs, it’s also important to note that performance can vary significantly across platforms. Some platforms like Facebook/Meta are highly effective for reaching new audiences and often have the best CPN (Cost Per Name).
Other platforms like Google search ads are great for retargeting known audiences and traffic, and can tend to have greater ROIs when re-marketing to existing donors during a high urgency campaign.
Growing your fundraising is hard. Our 3-Year Fundraising Roadmap makes it easier by bringing clarity and confidence to your program, making things less chaotic, more predictable, and more effective.